This sounds crazy, but it’s true. Vaccines do not deserve the credit for reducing contagious diseases. How do we know this?
Government Data Proves Vaccines Do Not Deserve the Credit for Reducing Contagious Diseases
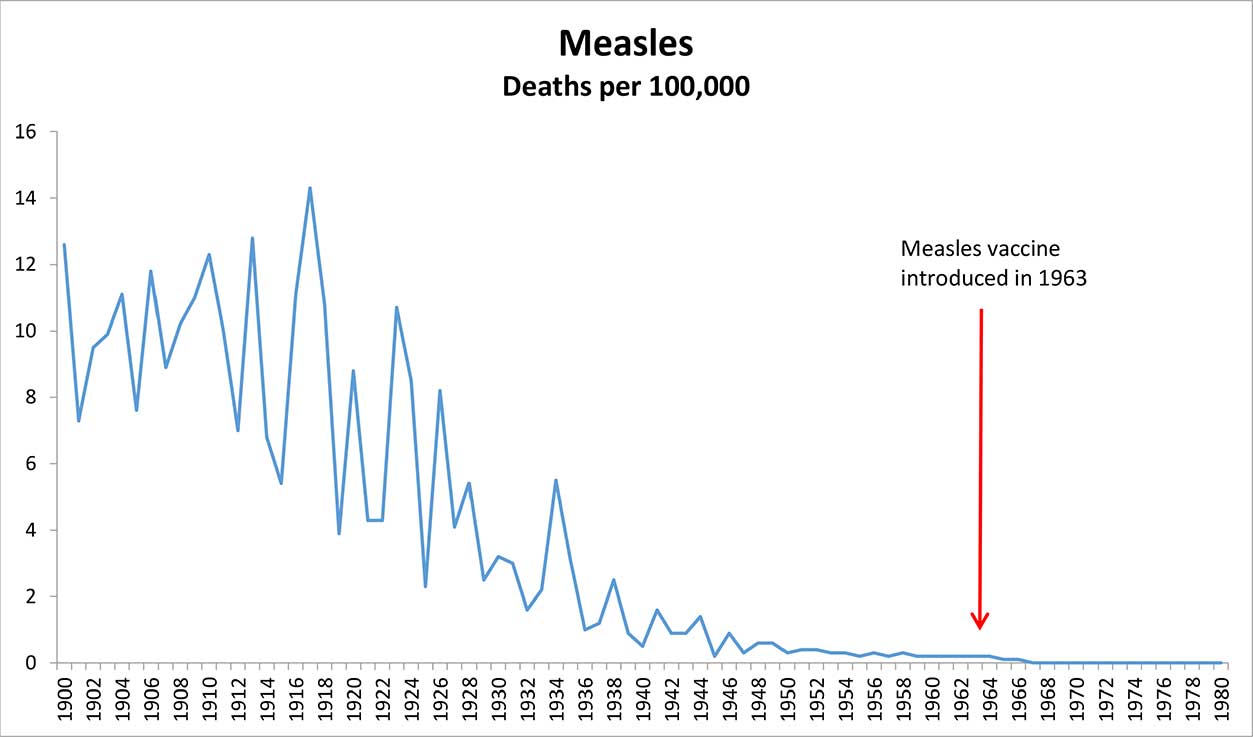
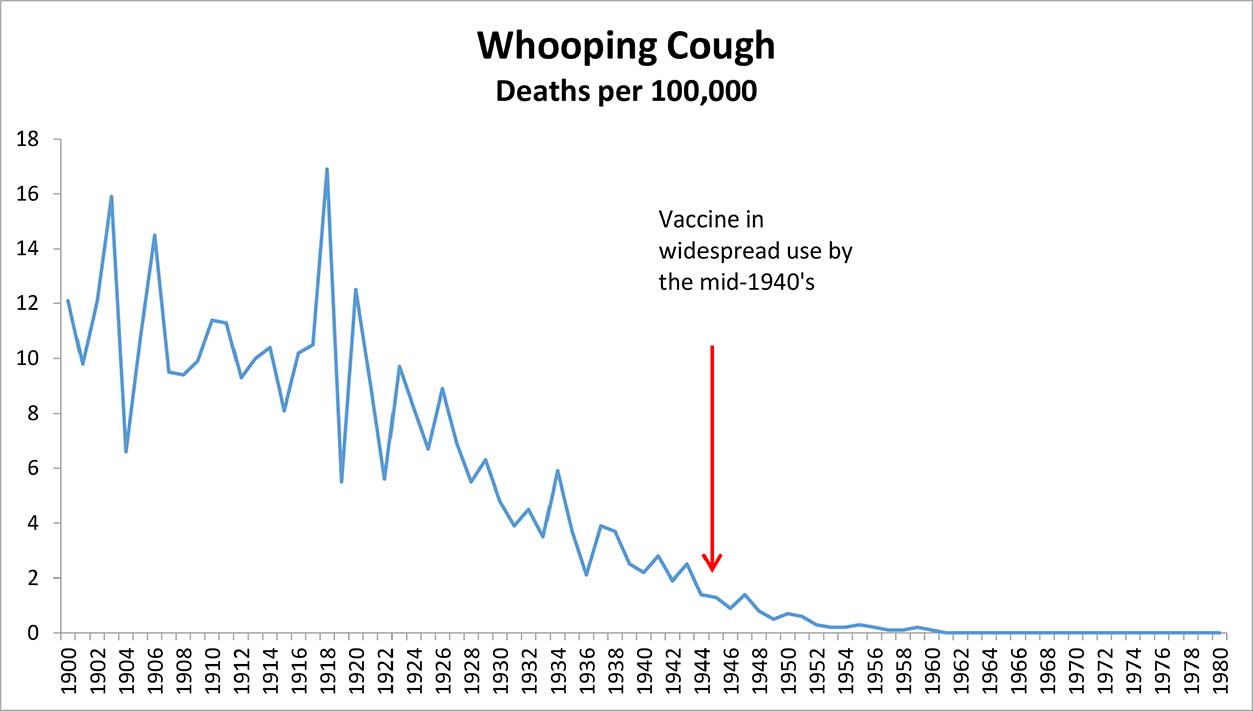
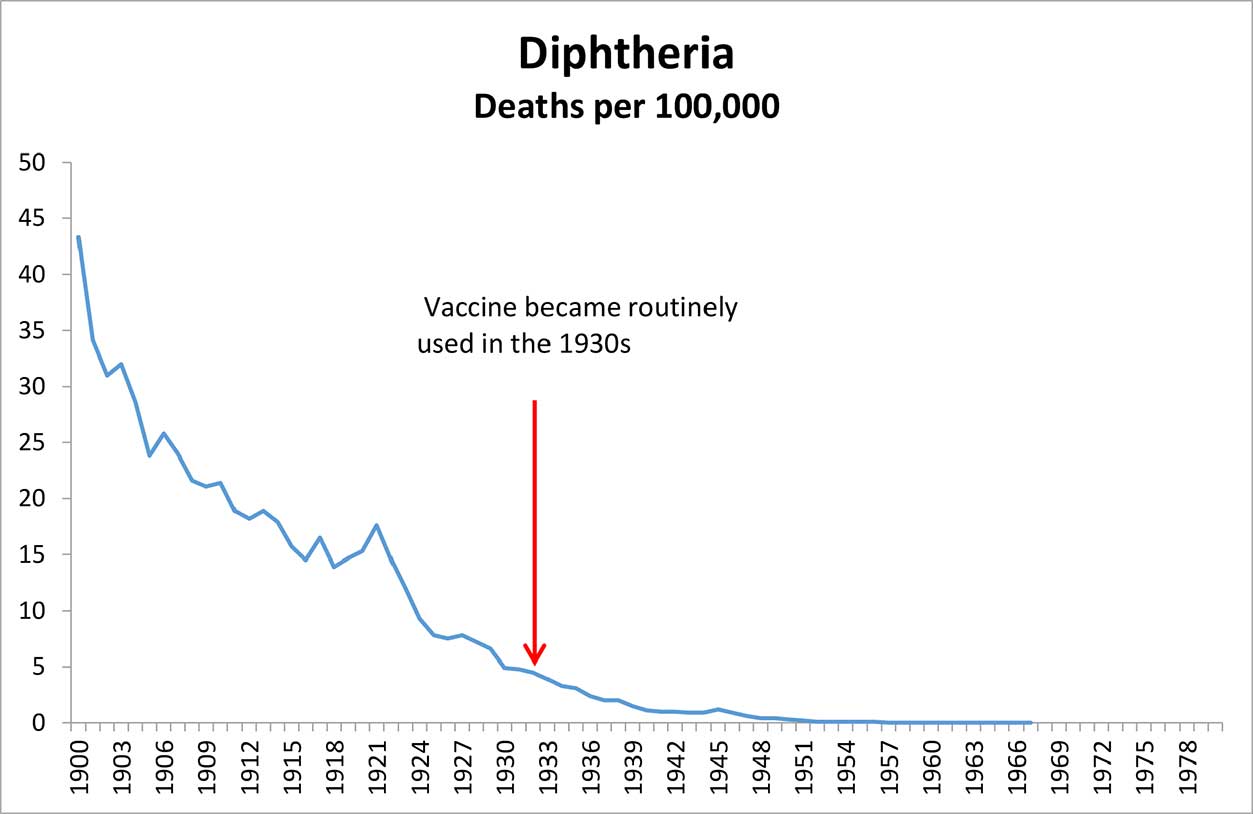
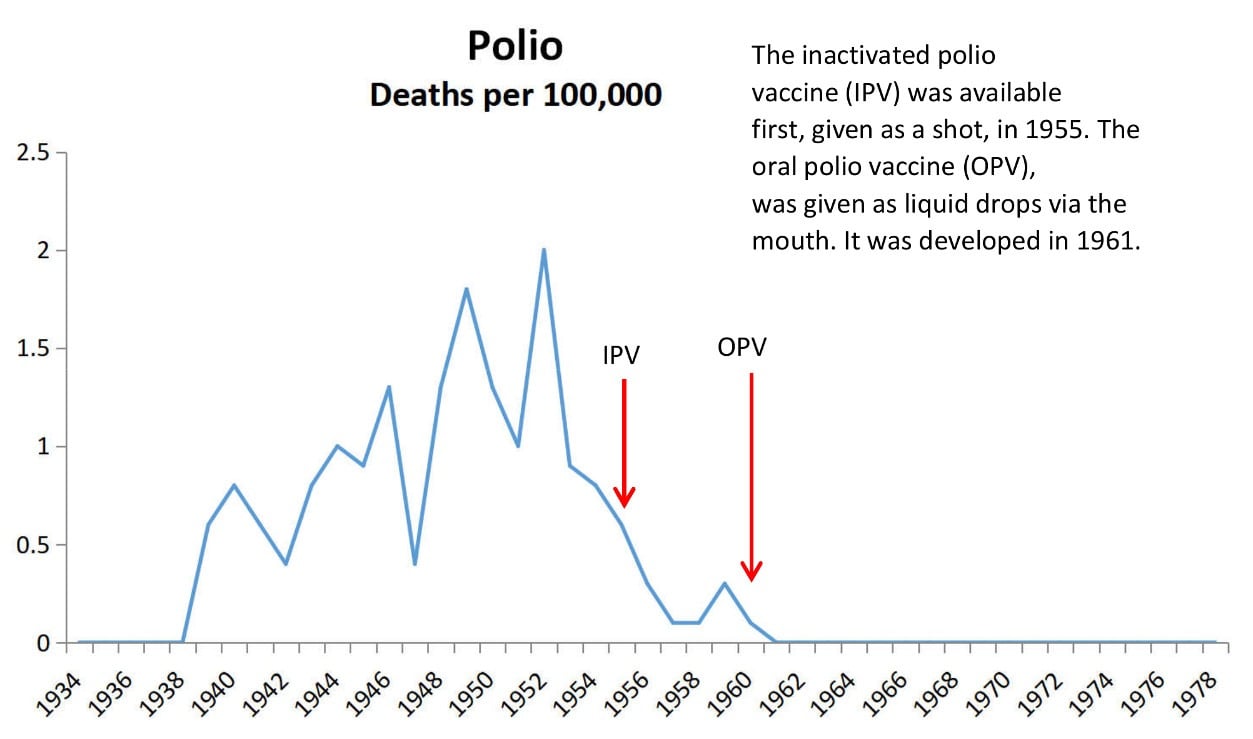
All we have to look at is the government’s own numbers from the Vital Statistics of the United States. It tells us the rates of death from various diseases. All of these rates went way down before the vaccines were invented.
The data comes from “The National Vital Statistics System (NVSS) provides the most complete data on births and deaths in the United States.” This system is overseen by the CDC.
Many people who have looked at this data had the sudden and uncomfortable realization that they have been lied to their entire lives. The medical profession is taking credit for making these diseases go away. They do not deserve the credit because vaccines did not make these diseases go away, better sanitation did.
Here’s what actually happened:


Here’s the data table and here’s the source data from The National Vital Statistics System.
| Causes of Death | 1900 | 1901 | 1902 | 1903 | 1904 | 1905 | 1906 | 1907 | 1908 | 1909 | 1910 | 1911 | 1912 | 1913 | 1914 | 1915 | 1916 | 1917 | 1918 | 1919 | 1920 | 1921 | 1922 | 1923 | 1924 | 1925 | 1926 | 1927 | 1928 | 1929 | 1930 | 1931 | 1932 | 1933 | 1934 | 1935 | 1936 | 1937 | 1938 | 1939 | 1940 | 1941 | 1942 | 1943 | 1944 | 1945 | 1946 | 1947 | 1948 | 1949 | 1950 | 1951 | 1952 | 1953 | 1954 | 1955 | 1956 | 1957 | 1958 | 1959 | 1960 | 1961 | 1962 | 1963 | 1964 | 1965 | 1966 | 1967 | 1968 | 1969 | 1970 | 1971 | 1972 | 1973 | 1974 | 1975 | 1976 | 1977 | 1978 | 1979 | 1980 | 1981 | 1982 | 1983 | 1984 | 1985 | 1986 | 1987 | 1988 | 1989 | 1990 | 1991 | 1992 | 1993 | 1994 | 1995 | 1996 | 1997 | 1998 | 1999 | 2000 | 2001 | 2002 | 2003 |
|---|---|---|---|---|---|---|---|---|---|---|---|---|---|---|---|---|---|---|---|---|---|---|---|---|---|---|---|---|---|---|---|---|---|---|---|---|---|---|---|---|---|---|---|---|---|---|---|---|---|---|---|---|---|---|---|---|---|---|---|---|---|---|---|---|---|---|---|---|---|---|---|---|---|---|---|---|---|---|---|---|---|---|---|---|---|---|---|---|---|---|---|---|---|---|---|---|---|---|---|---|---|---|---|---|
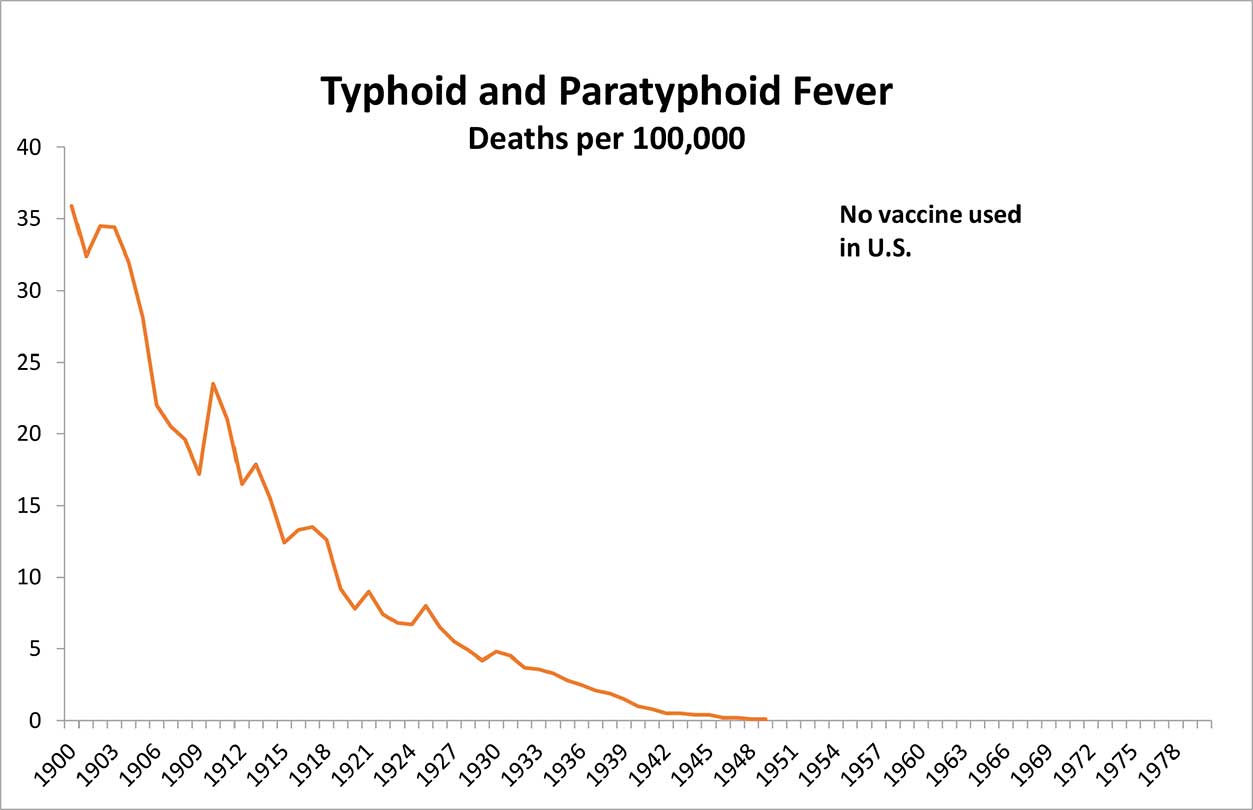
| Typhoid and paratyphoid fever | 35.9 | 32.4 | 34.5 | 34.4 | 32 | 28.1 | 22 | 20.5 | 19.6 | 17.2 | 23.5 | 21 | 16.5 | 17.9 | 15.5 | 12.4 | 13.2 | 13.5 | 12.6 | 9.2 | 7.8 | 9 | 7.4 | 6.8 | 6.7 | 8 | 6.5 | 5.5 | 4.9 | 4.2 | 4.8 | 4.5 | 3.7 | 3.6 | 3.3 | 2.8 | 2.5 | 2.1 | 1.9 | 1.5 | 1 | 0.8 | 0.5 | 0.5 | 0.4 | 0.4 | 0.2 | 0.2 | 0.1 | 0.1 | ||||||||||||||||||||||||||||||||||||||||||||||||||||||
| Smallpox | 1.9 | 3.5 | 6.6 | 4.3 | 2.1 | 0.9 | 0.1 | 0.1 | 0.1 | 0.1 | 0.4 | 0.2 | 0.3 | 0.2 | 0.3 | 0.3 | 0.2 | 0.3 | 0.4 | 0.4 | 0.6 | 0.7 | 0.7 | 0.1 | 0.9 | 0.7 | 0.4 | 0.1 | 0.1 | 0.1 | 0.1 | 0.1 | 0 | 0 | 0 | 0 | 0 | 0 | 0 | 0 | 0 | 0 | 0 | 0 | 0 | 0 | 0 | 0 | 0 | 0 | ||||||||||||||||||||||||||||||||||||||||||||||||||||||
| Measles | 12.6 | 7.3 | 9.5 | 9.9 | 11.1 | 7.6 | 11.8 | 8.9 | 10.2 | 11 | 12.3 | 10 | 7 | 12.8 | 6.8 | 5.4 | 11.1 | 14.3 | 10.8 | 3.9 | 8.8 | 4.3 | 4.3 | 10.7 | 8.5 | 2.3 | 8.2 | 4.1 | 5.4 | 2.5 | 3.2 | 3 | 1.6 | 2.2 | 5.5 | 3.1 | 1 | 1.2 | 2.5 | 0.9 | 0.5 | 1.6 | 0.9 | 0.9 | 1.4 | 0.2 | 0.9 | 0.3 | 0.6 | 0.6 | 0.3 | 0.4 | 0.4 | 0.3 | 0.3 | 0.2 | 0.3 | 0.2 | 0.3 | 0.2 | 0.2 | 0.2 | 0.2 | 0.2 | 0.2 | 0.1 | 0.1 | 0 | 0 | 0 | 0 | 0 | 0 | 0 | 0 | 0 | 0 | 0 | 0 | 0 | 0 | |||||||||||||||||||||||
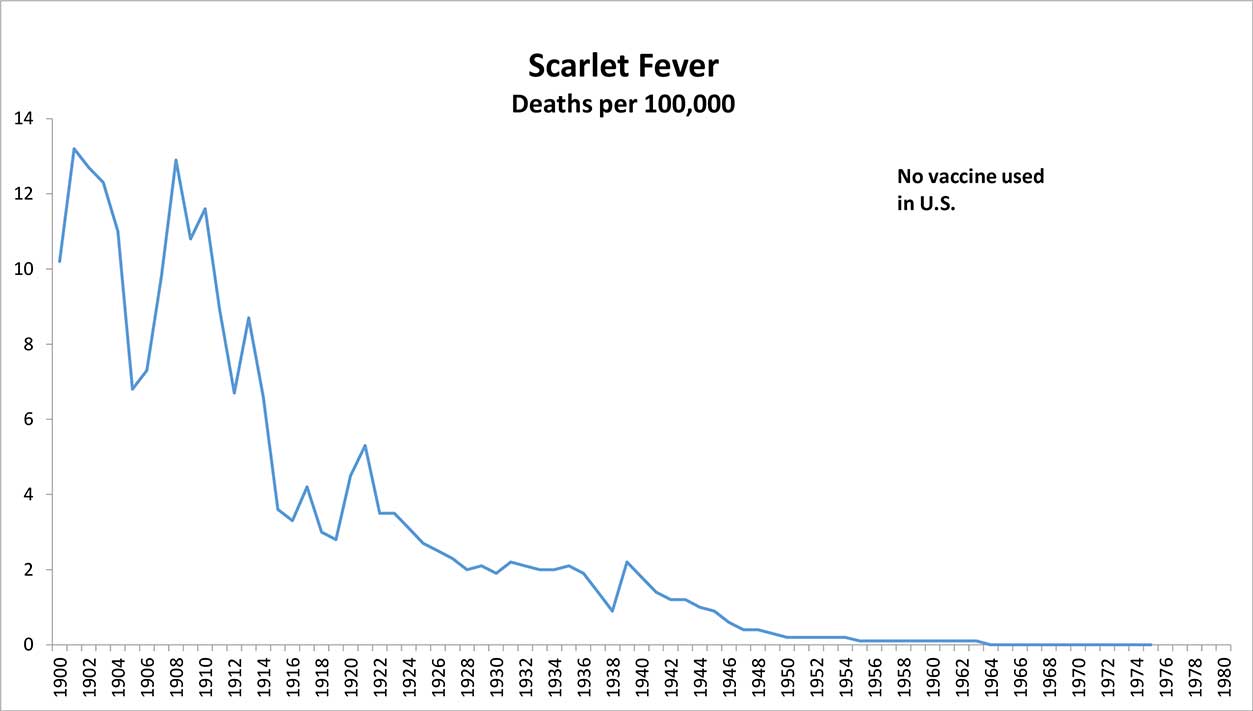
| Scarlet Fever | 10.2 | 13.2 | 12.7 | 12.3 | 11 | 6.8 | 7.3 | 9.8 | 12.9 | 10.8 | 11.6 | 8.9 | 6.7 | 8.7 | 6.6 | 3.6 | 3.3 | 4.2 | 3 | 2.8 | 4.5 | 5.3 | 3.5 | 3.5 | 3.1 | 2.7 | 2.5 | 2.3 | 2 | 2.1 | 1.9 | 2.2 | 2.1 | 2 | 2 | 2.1 | 1.9 | 1.4 | 0.9 | 2.2 | 1.8 | 1.4 | 1.2 | 1.2 | 1 | 0.9 | 0.6 | 0.4 | 0.4 | 0.3 | 0.2 | 0.2 | 0.2 | 0.2 | 0.2 | 0.1 | 0.1 | 0.1 | 0.1 | 0.1 | 0.1 | 0.1 | 0.1 | 0.1 | 0 | 0 | 0 | 0 | 0 | 0 | 0 | 0 | 0 | 0 | 0 | 0 | ||||||||||||||||||||||||||||
| Whooping Cough | 12.1 | 9.8 | 12.1 | 15.9 | 6.6 | 10.7 | 14.5 | 9.5 | 9.4 | 9.9 | 11.4 | 11.3 | 9.3 | 10 | 10.4 | 8.1 | 10.2 | 10.5 | 16.9 | 5.5 | 12.5 | 9.1 | 5.6 | 9.7 | 8.2 | 6.7 | 8.9 | 6.9 | 5.5 | 6.3 | 4.8 | 3.9 | 4.5 | 3.5 | 5.9 | 3.7 | 2.1 | 3.9 | 3.7 | 2.5 | 2.2 | 2.8 | 1.9 | 2.5 | 1.4 | 1.3 | 0.9 | 1.4 | 0.8 | 0.5 | 0.7 | 0.6 | 0.3 | 0.2 | 0.2 | 0.3 | 0.2 | 0.1 | 0.1 | 0.2 | 0.1 | 0 | 0 | 0 | 0 | 0 | 0 | 0 | 0 | 0 | 0 | 0 | 0 | 0 | 0 | 0 | 0 | 0 | 0 | 0 | 0 | |||||||||||||||||||||||
| Diptheria | 43.3 | 34.1 | 31 | 32 | 28.6 | 23.8 | 25.8 | 24 | 21.6 | 21.1 | 21.4 | 18.9 | 18.2 | 18.9 | 17.9 | 15.7 | 14.5 | 16.5 | 13.9 | 14.7 | 15.3 | 17.6 | 14.6 | 12 | 9.3 | 7.8 | 7.5 | 7.8 | 7.2 | 6.6 | 4.9 | 4.8 | 4.5 | 3.9 | 3.3 | 3.1 | 2.4 | 2 | 2 | 1.5 | 1.1 | 1 | 1 | 0.9 | 0.9 | 1.2 | 0.9 | 0.6 | 0.4 | 0.4 | 0.3 | 0.2 | 0.1 | 0.1 | 0.1 | 0.1 | 0.1 | 0 | 0 | 0 | 0 | 0 | 0 | 0 | 0 | 0 | 0 | 0 | ||||||||||||||||||||||||||||||||||||
| Polio | 0 | 0 | 0 | 0 | 0 | 0 | 0 | 0 | 0 | 0 | 0 | 0 | 0 | 0 | 0 | 0 | 0 | 0 | 0 | 0 | 0 | 0 | 0 | 0 | 0 | 0 | 0 | 0 | 0 | 0.6 | 0.8 | 0.6 | 0.4 | 0.8 | 1 | 0.9 | 1.3 | 0.4 | 1.3 | 1.8 | 1.3 | 1 | 2 | 0.9 | 0.8 | 0.6 | 0.3 | 0.1 | 0.1 | 0.3 | 0.1 | 0 | 0 | 0 | 0 | 0 | 0 | 0 | 0 | 0 | 0 | 0 | 0 | 0 | 0 | 0 | 0 | 0 | 0 | 0 | 0 |
Here are the six diseases together:
Better Sanitation Reduced and Eliminated Contagious Diseases
Notice how they all go down at about the same rate at about the same time. This was because of improvements in sanitation, hygiene, and clean drinking water especially in the cities. Here’s the graph of homes that do not have indoor plumbing. Here’s the sources of the data.

Here’s the decline in mortality from diseases with the decrease in people who had poor sanitation.

Notice how they all track together. Remember, scarlet fever and typhoid went down and disappeared with no vaccine at all.