The 2020 ADDM Report on U.S. Autism Prevalence: Three Reasons Why The Popular Narrative Was Misleading

The March 26 release of the CDC’s new Autism and Developmental Disabilities Monitoring (ADDM) Network report drew scarcely a ripple of notice or concern, in a nation consumed with the coronavirus lockdown. For the last two decades, ADDM has conducted biannual surveillance of autism spectrum disorder (ASD) prevalence among American children. The new 2020 report found a nationwide ASD prevalence of 1 in 54 among 8 year-olds born in 2008. (In practice, “nationwide” means an average over selected counties in 11 states.) The large majority of ASD cases were among boys, whose prevalence was as high as 1 in 20 in New Jersey.
The Associated Press story on the new report attributed the increase to better diagnosis among black children, thereby dispelling concern about what was effectively a 10% increase in prevalence compared to the previous report released in 2018. (Interestingly, media coverage of that 2018 ADDM report invoked the same explanation to downplay concern over the increase in ASD prevalence from 1 in 68 children born in 2004 to 1 in 59 children born in 2006.) The March 2020 AP article stated, “Autism has grown slightly more common in the U.S., but a gap in diagnosis of white and black kids has disappeared … Closure of that gap – thanks to increased screening – is the main reason autism diagnoses are up a little, some experts said.” (All emphasis mine.)
The upbeat narrative is inaccurate and omits some important facts
First, the increase in autism among black children is not the main reason why overall ASD prevalence is up in the new 2020 report. The ADDM data indicate that ASD rates have been increasing broadly across all races over the last 3 reports. Nationwide, the increase among black children accounts for only 27% of the overall increase from birth year 2004 to 2008, as shown in Figure 1. Whites account for 30% of the increase, Hispanics 31% and Asians 12%. Thus, the AP statement attributing most of the increase to black children is misleading and mathematically incorrect.
 [Figure 1. The contribution by race/ethnicity to the overall nationwide increase in ASD prevalence (in %) among American 8 year-olds over the last 3 ADDM reports, spanning birth years 2004, 2006 and 2008.]
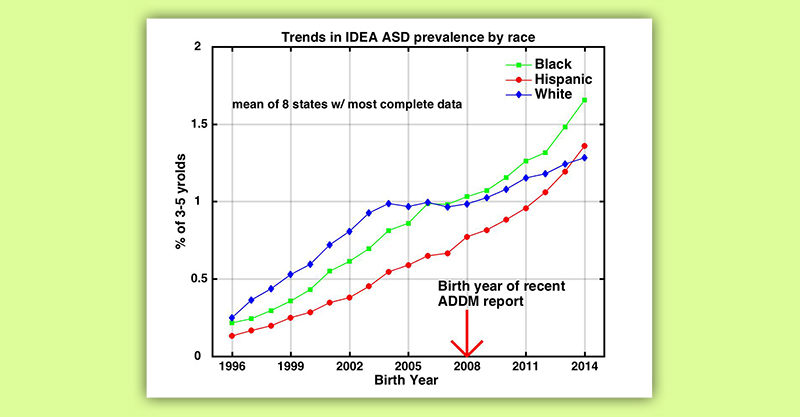
Second, my recent study with Walter Zahorodny showed that ASD rates among 3-5 year-old minority children were not just “closing the gap,” they were surpassing white rates. Our study used U.S. Department of Education Individuals with Disabilities Education Act (IDEA) data. I recently updated the calculations, incorporating IDEA data from 2018-19, and found that the trends we reported in our paper are continuing. ASD prevalence is increasing fastest among minority children, with overall rates among black children, and now Hispanic children too, exceeding those among white children in the majority of states, even as white rates themselves continue to climb. In contrast, the AP narrative assumes that there is some natural genetic level of ASD prevalence in the population, that white rates have stabilized at that level, and that minorities are now catching up and will stabilize at a similar level, thanks to improved outreach and screening. None of those assumptions are supported by the actual available data.
 Figure 2. ASD prevalence by race/ethnicity among 3-5 year-old children in the U.S. Department of Education IDEA dataset (mean of 8 states with highest ascertainment), updated from Nevison and Zahorodny (2019) to include 2018-19 IDEA data.
The third and most objectionable aspect of the narrative surrounding the new ADDM report was the self-congratulatory use of minority children to claim “better diagnosis” while ignoring large disparities in their co-occurring rates of intellectual disability (ID). Specifically, the AP story portrayed increasing ASD rates among black children as a marker of progress in diagnosing ASD but neglected to mention that their co-occurring ID rate was nearly twice that of white children (47% vs. 27%). Given that co-occurring ID is a measure of the severity of autism, it is questionable whether black families should be heartened by the increasing ASD rates among their children, as the AP coverage insinuated.
A closer look at ASD with co-occurring ID rates in ADDM data reveals some interesting – and troubling – patterns. Among children diagnosed with ASD, the fraction with co-occurring ID is substantially higher among black and Hispanic children compared to white children (see Figure 3). Furthermore, this is a long-standing result known since at least birth year 2002. Figure 3 also shows that in the earliest ADDM reports, which focused on children born in the 1990s, the overall percentage with co-occurring ID across all races was considerably higher than today but dropped between birth years 1998 and 2002 and has stayed relatively low since then. This same period, around birth year 2000, coincides with the flattening or even decline of severe autism prevalence among wealthy white and Asian children that William Parker and I identified recently in California Dept. of Developmental Services (DDS) data. These results beg the question: what happened around birth year 2000 that might have caused the California DDS and ADDM co-occurring ID trends?
 Figure 3. Percent by race of nationwide ADDM ASD prevalence with co-occurring intellectual disability (ID). Note that race-specific ID data are available only from birth year 2002.
An additional important point is that the absolute prevalence of American children with severe autism (i.e., with co-occurring ID) has been increasing with time, especially among black children (as shown in Figure 4). This is true, despite the reduction around birth year 2000 in the fraction of ASD cases with co-occurring ID, simply because the absolute prevalence of ASD has increased sharply since the 1990s.
 Figure 4. Absolute prevalence nationwide of ADDM ASD with co-occurring intellectual disability, overall and broken out by race
In conclusion, close to a hundred thousand American children per year are being diagnosed with ASD, a generally lifelong condition that profoundly affects their childhood, schooling and ultimately their ability to live and work independently. It seems reasonable to ask that public health officials stop downplaying the ongoing increase in U.S. ASD prevalence and start taking their own data seriously. Even a small fraction of the resources currently being devoted to controlling COVID-19 could go a long way toward identifying the environmental causes of ASD, especially severe autism, and provide parents with practical advice on how to prevent it.
References:
Centers for Disease Control and Prevention. (2007a). Prevalence of Autism Spectrum Disorders — Autism and Developmental Disabilities Monitoring Network, Six sites, United States, 2000.” Morb Mortal Wkly Rep 56 (SS01): 1–11.
Centers for Disease Control and Prevention. (2007b). Prevalence of Autism Spectrum Disorders — Autism and Developmental Disabilities Monitoring Network, 14 Sites, United States, 2002. Morb Mortal Wkly Rep. 56(SS01):12–28.
Centers for Disease Control and Prevention. (2009). Prevalence of Autism Spectrum Disorders — Autism and Developmental Disabilities Monitoring Network, United States, 2006. Morb Mortal Wkly Rep 58(10):1–24.
Centers for Disease Control and Prevention. (2012). Prevalence of Autism Spectrum Disorders — Autism and Developmental Disabilities Monitoring Network, 14 Sites, United States, 2008. Morb Mortal Wkly Rep. 61(3):1–19.
Centers for Disease Control and Prevention. (2014). Prevalence of autism spectrum disorder among children aged 8 years – autism and developmental disabilities monitoring network, 11 sites, United States, 2010.” Morbidity and mortality weekly report 63 Suppl 2 (2): 1–21. .
Centers for Disease Control and Prevention. (2016). Prevalence and Characteristics of Autism Spectrum Disorder Among Children Aged 8 Years — Autism and Developmental Disabilities Monitoring Network , 11 Sites , United States , 2012.” MMWR Surveill Summ 65 (3).
Centers for Disease Control and Prevention. (2018). Prevalence and Characteristics of Autism Spectrum Disorder Among Children Aged 8 Years — Autism and Developmental Disabilities Monitoring Network , 11 Sites , United States , 2014.” MMWR Surveill Summ 67 (6).
Centers for Disease Control and Prevention. (2020). Prevalence and Characteristics of Autism Spectrum Disorder Among Children Aged 8 Years — Autism and Developmental Disabilities Monitoring Network , 11 Sites , United States , 2016.” MMWR Surveill Summ 69 (4).
Nevison, C.D. and Zahorodny, W. (2019) Race/Ethnicity-Resolved Time Trends in United States ASD Prevalence Estimates from IDEA and ADDM, J. Autism and Dev Disord, 49(12), 4721-4730.
Nevison, C.D. and Parker, W. (2020), California autism prevalence by county and race/ethnicity: Declining trends among wealthy whites, J. Autism and Dev Disord, published online March 19, 2020.
Methods
Figure 1. For each site and race/ethnicity, ASD prevalence and total survey populations were obtained from tables in the MMWR reports, usually from Table 2 and Table 1, respectively. ASD prevalence was multiplied by total survey population to obtain total ASD cases for each site and race/ethnicity. The case totals were summed over all sites and divided by the overall total survey population to estimate the contribution by race/ethnicity to nationwide ASD for each survey year. Note that the summed total prevalence is slightly less than the overall reported rate (e.g., 1.79% in birth year 2008 rather than the reported 1.85%), likely because a small number of cases had unknown or other race/ethnicity.
Figure 2. Updated from Nevison and Zahorodny, 2019 incorporating IDEA 3-5 year-old ASD counts from the 2018/19 school year.
Figure 3. The overall fraction with co-occurring ID was taken directly from the text of the MMWR reports for birth years 1992-2008. The fractions by race/ethnicity with co-occurring ID were reported directly in the text for birth years 2002, 2006 and 2008, and were also independently calculated based on the MMWR bar graphs, using Figure 4 for birth year 2002 and 2004, Figure 2 for birth year 2006, and Supplementary Figure 3 for birth year 2008 (assuming 80% male/20% female for each race/ethnicity for these last 2 reports).
Figure 4. ASD prevalence across all sites for each race/ethnicity was taken from the MMWR reports (Table 2, Table 3, Table 3 and Supplementary Table 7 for birth year 2002, 2004, 2006 and 2008, respectively). For each race/ethnicity, ASD prevalence was multiplied by the fraction with co-occurring ID from Figure 3 above to calculate the absolute prevalence of ASD with co-occurring ID.
Sign up for free news and updates from Children’s Health Defense. CHD focuses on legal strategies to defend the health of our children and obtain justice for those injured. We can't do it without your support.