Lessons from the Lockdown—Why Are So Many Fewer Children Dying?


Originally Published as a White Paper from Health Choice
Covid19 is a serious public health issue, but the breathless reporting among the media of positive tests and an ever‐rising death toll does little to instruct us about the true nature of the virus and the unprecedented steps taken to prevent its impact. As in many complex and pervasive health phenomena, there are many ways to measure health effects, but in our view the proper measure of impact is not a narrow or intermediate metric, but rather total health outcomes. In the case of a pandemic virus affecting large populations and where the immediate concern is sharp increases in deaths, the best measure of outcomes is not a selective measure of deaths somehow attributed to the disease but instead is deaths from all causes. For perspective, these deaths must be compared to historical death rates from all causes in prior years (Percent of Expected Deaths). As we will show, a balanced view of the broader American Covid19 experience demonstrates both the scale and variability of its negative outcomes in older American, especially the elderly, but also some unexpected positives. Surprisingly, U.S. mortality rates have declined among young people during the lockdown, especially among infants. These trends have gone largely unnoticed and remain unexplained.
Death rates from all causes vary widely and somewhat predictably. The most pronounced variation occurs by age cohort (most deaths occur in the elderly) and by time of year and to a lesser extent by geography. All‐cause deaths are cyclical, commonly rising in the winter months and “flu season” and then falling to lower levels as warmer weather arrives. To the extent that death rates vary by region, this is mostly a result of differences in the age mix of residents. In the case of Covid19, death rates are not yet known to be cyclical but they do vary significantly by age and geography.
In the analysis that follows we have examined the evidence on total death rates by geography (mostly by state), by age group and by week (and flu season). We have extracted eight main lessons. Some of these are part of the ongoing conversation around Covid19; others are unexpected or at least have not been widely circulated. Why this discrepancy? Since the infectious disease establishment has controlled the “pandemic” narrative, the variance between this evidence and conventional wisdom is largely driven by longstanding bias and error patterns among the experts in that community.
Overall U.S. trend
The Covid19 impact on all‐cause deaths has been sharp and clear. Tens of thousands more Americans than expected died in a brief period. [1]
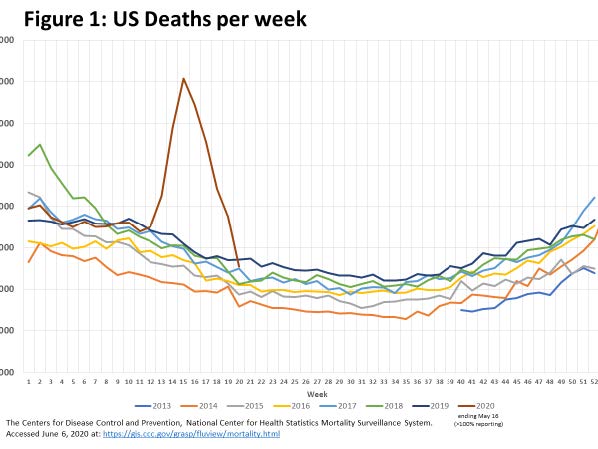
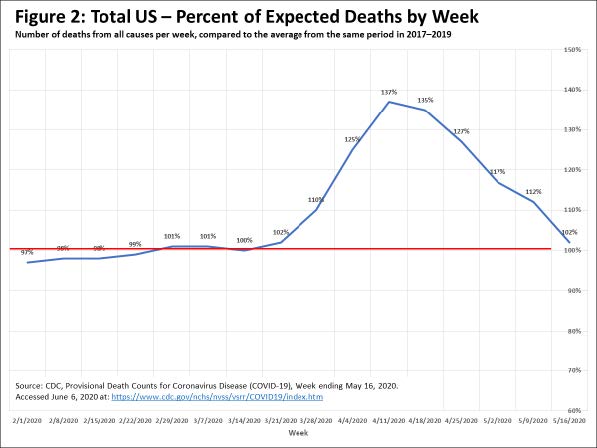
Before mid‐March, overall U.S. deaths were trending at a level no different from recent years at between 55‐60,000 per week. Beginning in the week ending on March 28, all‐cause deaths began rising sharply, peaking in the week ending April 11 at around 75,000, or 137% of Expected Deaths for the week. Immediately thereafter, all-caused deaths began dropping sharply.
Within five weeks, all‐cause deaths were back to their typical range. By the week ending May 16, the measurable pandemic death impact had ended even though Covid19‐related deaths most certainly had not.[2]
Attributing a Cause of Death (COD) to COVID‐19 is not always clear‐cut, due to significant overlap among COVID‐19, Pneumonia, Influenza, and presumably other primary CODs. [2]
That said, the spike in deaths officially attributed to COVID‐ 19 occurred in tandem with the spike in all‐cause deaths, leaving little doubt that Covid19 was the main contributor to the excess of expected deaths between March 22 and May 9.
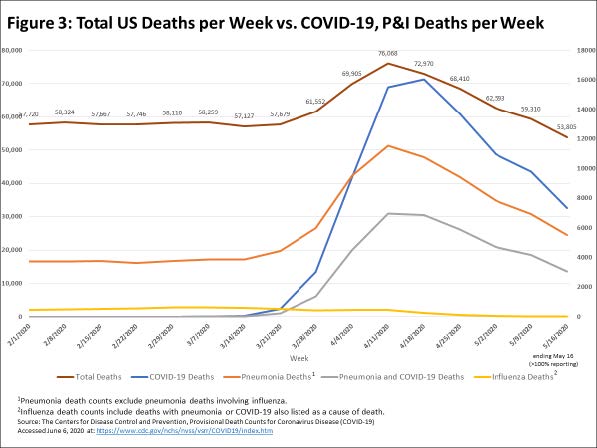
At least in this 8‐week period, the Covid19 pandemic was considerably worse than a typical flu season. To the extent that all‐cause deaths fell back to expected levels during May, the excess mortality attributable to the pandemic has passed. [1]

Localization
Increases in all‐cause death rates during the pandemic have been extremely localized, varying widely by state/jurisdiction. For the 3 ½ month period surrounding the pandemic, starting on February 1 through May 16 (the most recent period with 100% reporting), total deaths in the US came in at 105% of expectations. [2]
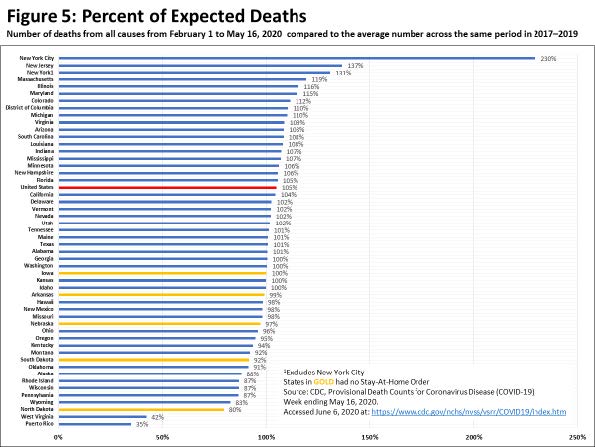
Many states actually saw lower than expected deaths during the period. To be sure, an excess death rate of 5% for the entire U.S. is considerable but also far short of the apocalyptic narrative the pandemic has received.
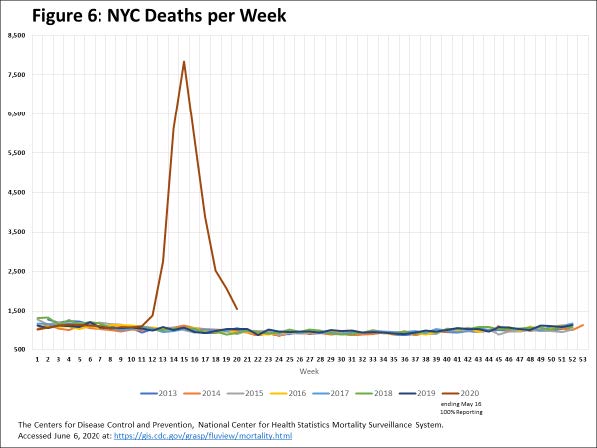
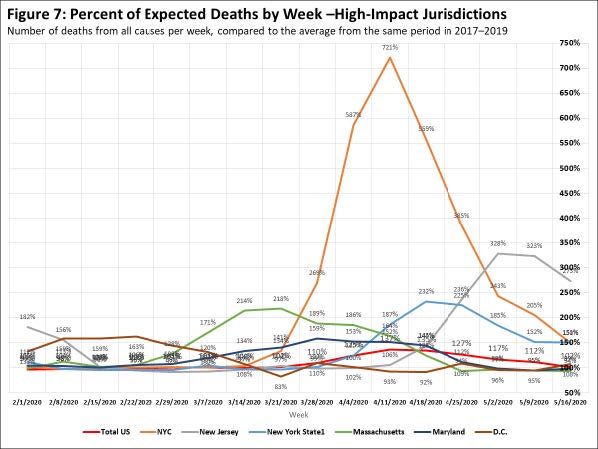
Greater‐than‐expected death rates were heavily concentrated in the Northeastern corridor. New York City and its surrounding area, including New Jersey, New York State (although possibly not upstate New York), Connecticut, Massachusetts, Maryland and the District of Columbia have so far comprised 6 of top 8 jurisdictions with excess all‐cause deaths. New York City was hit especially hard. In a typical spring, New York City could expect 700‐800 all‐cause deaths per week. From mid‐ March to mid‐May, that number spiked sharply, by ten times that amount, reaching over 7500 deaths in the peak week ending April 11. [1]
Other Northeastern states saw sharp increases in expected deaths but nowhere near New York City’s rate. [2] The timing of the peaks has varied, Massachusetts came soonest, followed by Maryland, New York City New York State and New Jersey. Nevertheless, the entire region saw declines in expected deaths starting in May.
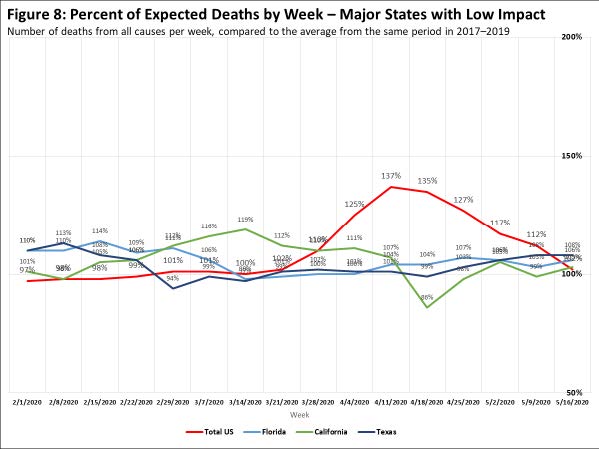
Many states saw no or only a modest increase in expected deaths, including some of the largest states such as California, Florida and Texas. [2] This suggests there may have been specific factors that influenced the experience in New York City that were not shared elsewhere.
Variation by policy environment
To the extent that policies have varied across the states, it is not clear that the imposition and/or presence of stringent lock‐down policies had much to do with the variation in excess deaths. Less stringent lockdown policies were not associated with higher death rates. In fact, the 5 states that chose not to impose a lockdown are among the roughly 20 jurisdictions with no excess deaths at all. [2]

Several states with the most aggressive lockdowns, including California, Maine, Minnesota and Pennsylvania showed almost no excess deaths effect. Despite huge population centers, California looked nothing like New York City and State. Maine, a mostly rural state, imposed among the more draconian policies with essentially no reason. Minnesota followed a far more aggressive lockdown policy than its neighboring states of Iowa, South Dakota, North Dakota and Wisconsin. Yet it’s Covid19 deaths were among the most concentrated in the country: roughly 80% of Minnesota’s Covid19 deaths occurred among the infirm elderly who were residents of long‐term care facilities. [2]
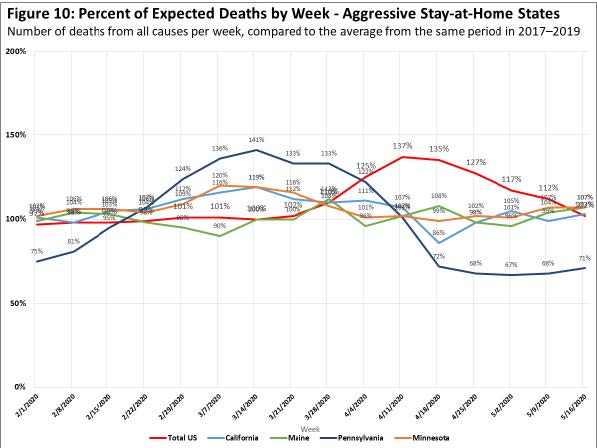
Did aggressive lockdowns stave off the worst‐case scenario, preventing vulnerable states from becoming disaster areas like New York City? No controlled experiment will give us that answer. Pennsylvania makes the best case for that argument, with an early excess death pattern that resembled its neighbors in the Northeastern corridor but saw that rate drop precipitously by early April. But Pennsylvania is also an unusual geographic unit, with its largest city, Philadelphia, lying on the coast and separated from the western part of the state and its second largest city, Pittsburgh, by the Appalachian Mountains. This anomaly makes it difficult to draw clear conclusions from Pennsylvania’s Covid19 curve.
Age effect: elderly
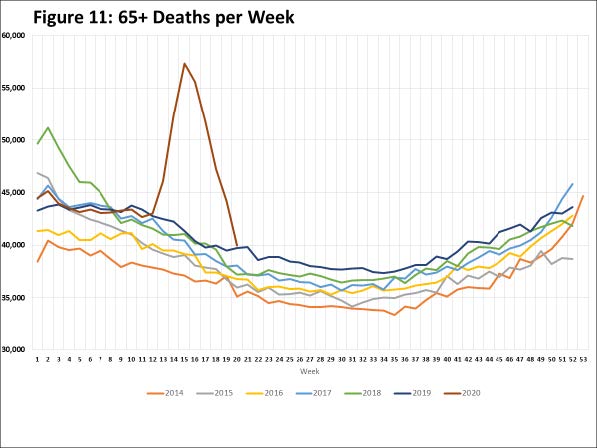
One universally accepted fact of the Covid19 pandemic is that the death risk is highest among the elderly. The all‐cause death numbers show this effect clearly, with a stark increase in deaths among those 65 years and older beginning in late March, peaking in early April and then turning sharply downward in May, so that by month end the excess death rate has almost disappeared. [1] Tens of thousands of excess deaths in this age group have driven a large portion of overall US excess deaths.
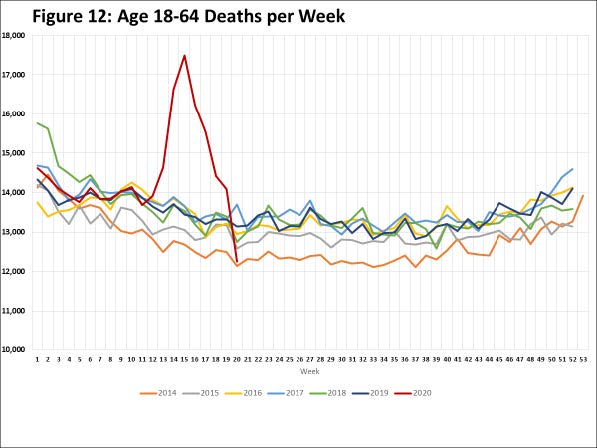
Adults between 18‐64 years of age show a similar pattern in excess deaths as the elderly, although the overall death toll has been less. [1]
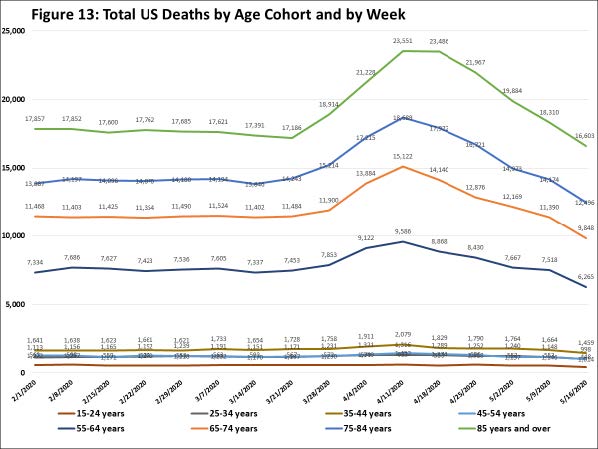
With a dataset that provides more detailed age groupings, the impact is even more clear: the older the age cohort, the more total deaths increased during the pandemic. [3] The largest number of deaths as well as increases in deaths occur in those aged 85 years old and older, followed by those aged 75‐84, next by the age group from 65-74. The sole remaining group showing an increase in deaths during the pandemic was the group aged 55‐64, with a modest increase in deaths during April. For all age cohorts with ages under 55, the impact of the pandemic is undetectable.
Most observers believe they understand this age effect and discount it. That older people die more frequently is no excuse not to protect them from the pandemic. But as we have deployed lockdowns as a blunt instrument to protect the elderly from a tragic and premature loss of life‐years, we have missed a completely unintended and beneficial benefit of the lockdowns: an unexplained collapse in excess deaths among the young, especially children and infants.
Age effect: children
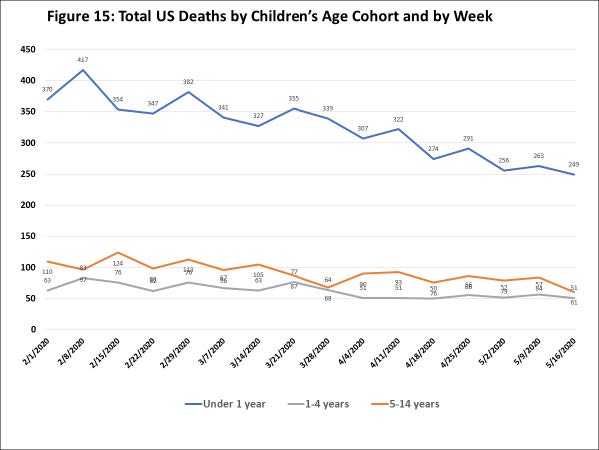
Deaths among children under 18 years of age are relatively rare and show patterns that are different from their seniors. The pronounced cyclical effect in all‐cause deaths one sees among adults is entirely absent in children. And whereas weekly deaths among adults dominate the overall US death toll—around 13,000 deaths per week in 18‐64‐year‐olds and 35‐40,000 deaths per week among those 65 and older—weekly deaths among children are scattered across the states and typically fall around 700. Well over half of that occurs in infants under 1 year of age.
But the pandemic experience has brought on a surprising effect on this expected death rate among children. Starting in early March, expected deaths began a sharp decline, from an expected level of around 700 deaths per week to well under 500 by mid‐April and throughout May. [1]
As untimely deaths spiked among the elderly in Manhattan nursing homes and in similar settings all over the country, something mysterious was saving the lives of children. As springtime in America came along with massive disruptions in family life amid near universal lockdowns, roughly 30% fewer children died.

Was this a protective effect of school closures? Were teenagers getting themselves into risky situations at a lower rate? No. There was very little effect among school age children or adolescents. [3]
Virtually the entire change came from infants. Somehow, the changing pattern of American life during the lockdowns has been saving the lives of hundreds of infants, over 200 per week.
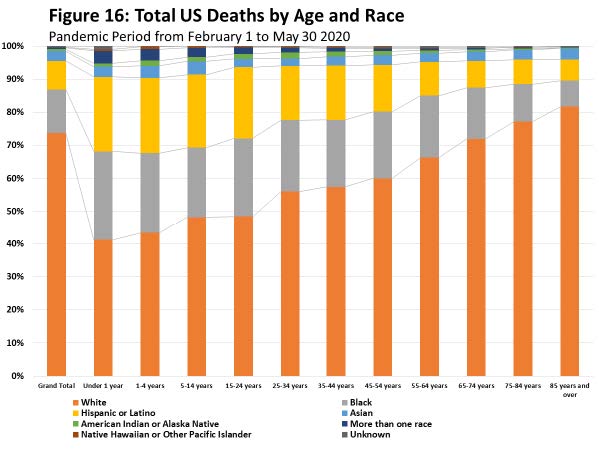
Deaths in infants and children occur at a higher rate in minority groups. [4] So the reduction in childhood deaths during the lockdowns has meant that the lives of black and Hispanic infants and children have been saved at a higher rate.
Net effect in life‐years
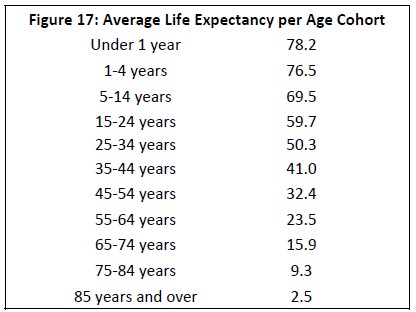 Every untimely death is tragic. But if one considers life‐years lost, the premature death of an infant carries more weight than the premature death of someone whose life expectancy is 5 years or less. And whereas the median age at death of, say, a Minnesotan dying of Covid19 is 83, the typical life expectancy of that senior citizen absent Covid19 might be just 2‐3 more years. By comparison, when an infant in lockdown avoids a death, the potential impact in life years saved can rise to 80 years or more. [5]
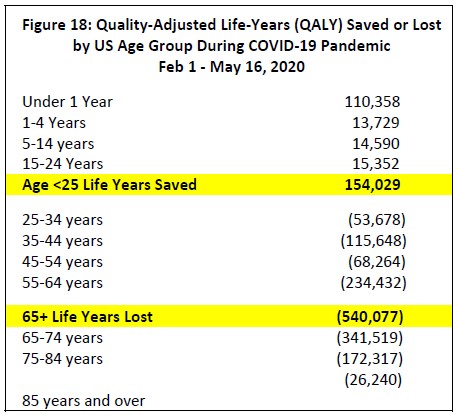 When one measures the net effect of life years either lost or gained during the pandemic and associated lockdowns, the net result across age groups is unexpectedly mixed. Not surprisingly, excess deaths are highest in the oldest seniors where life expectancy is the lowest. Combining the excess deaths with life expectancy by age group (with an adjustment for the quality of those life‐years) shows the toll of the pandemic: about 540,000 life‐years lost among those 65 and older. [3, 5, 6] By comparison, the reduction in expected deaths is highest in infants, where the life expectancy benefits are the greatest. Compared to expectations, the lives of over 200 infants per week were saved during the month of May. Combining the number of lives saved in infants and children aged 1‐4, demonstrates a smaller but comparably large and beneficial effect: roughly 145,000 life‐years saved among children under 5. Noting the surprising effect of the lockdown on infants and children under 5 does nothing to negate the tragic effect of the pandemic on the elderly. It does, however, raise a question: why are so many fewer children dying?
Causation?
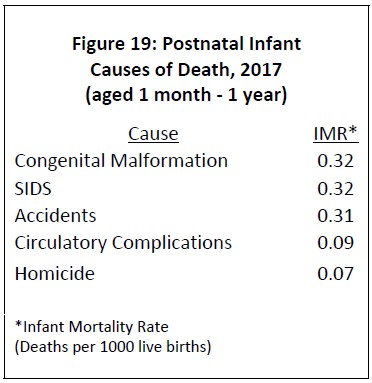 When infants die, the cause is frequently some form of congenital condition or birth defect. Sadly, accidents and homicides are frequent causes as well. There are however, frequent cases in which previously healthy infants die unexpectedly. These deaths are usually classified as “Sudden Infant Death Syndrome” or SIDS. According to the CDC, SIDS deaths are one of the two largest causes of death among infants aged 1 month to 1 year. [7]
We have no specific data on the trend in SIDS deaths during the pandemic. We have, however, heard anecdotal reports from emergency room (ER) doctors suggesting some have observed a decline in SIDS. One group of doctors who might see 3 cases of SIDS in a typical week has seen zero cases since the pandemic and associated lockdowns began.
What has changed during this period that might have such an effect? Are infant deaths not being recorded? Are parents taking better care of their families while working remotely and their children are not going to school? There are many possible hypotheses about the infant death decline.
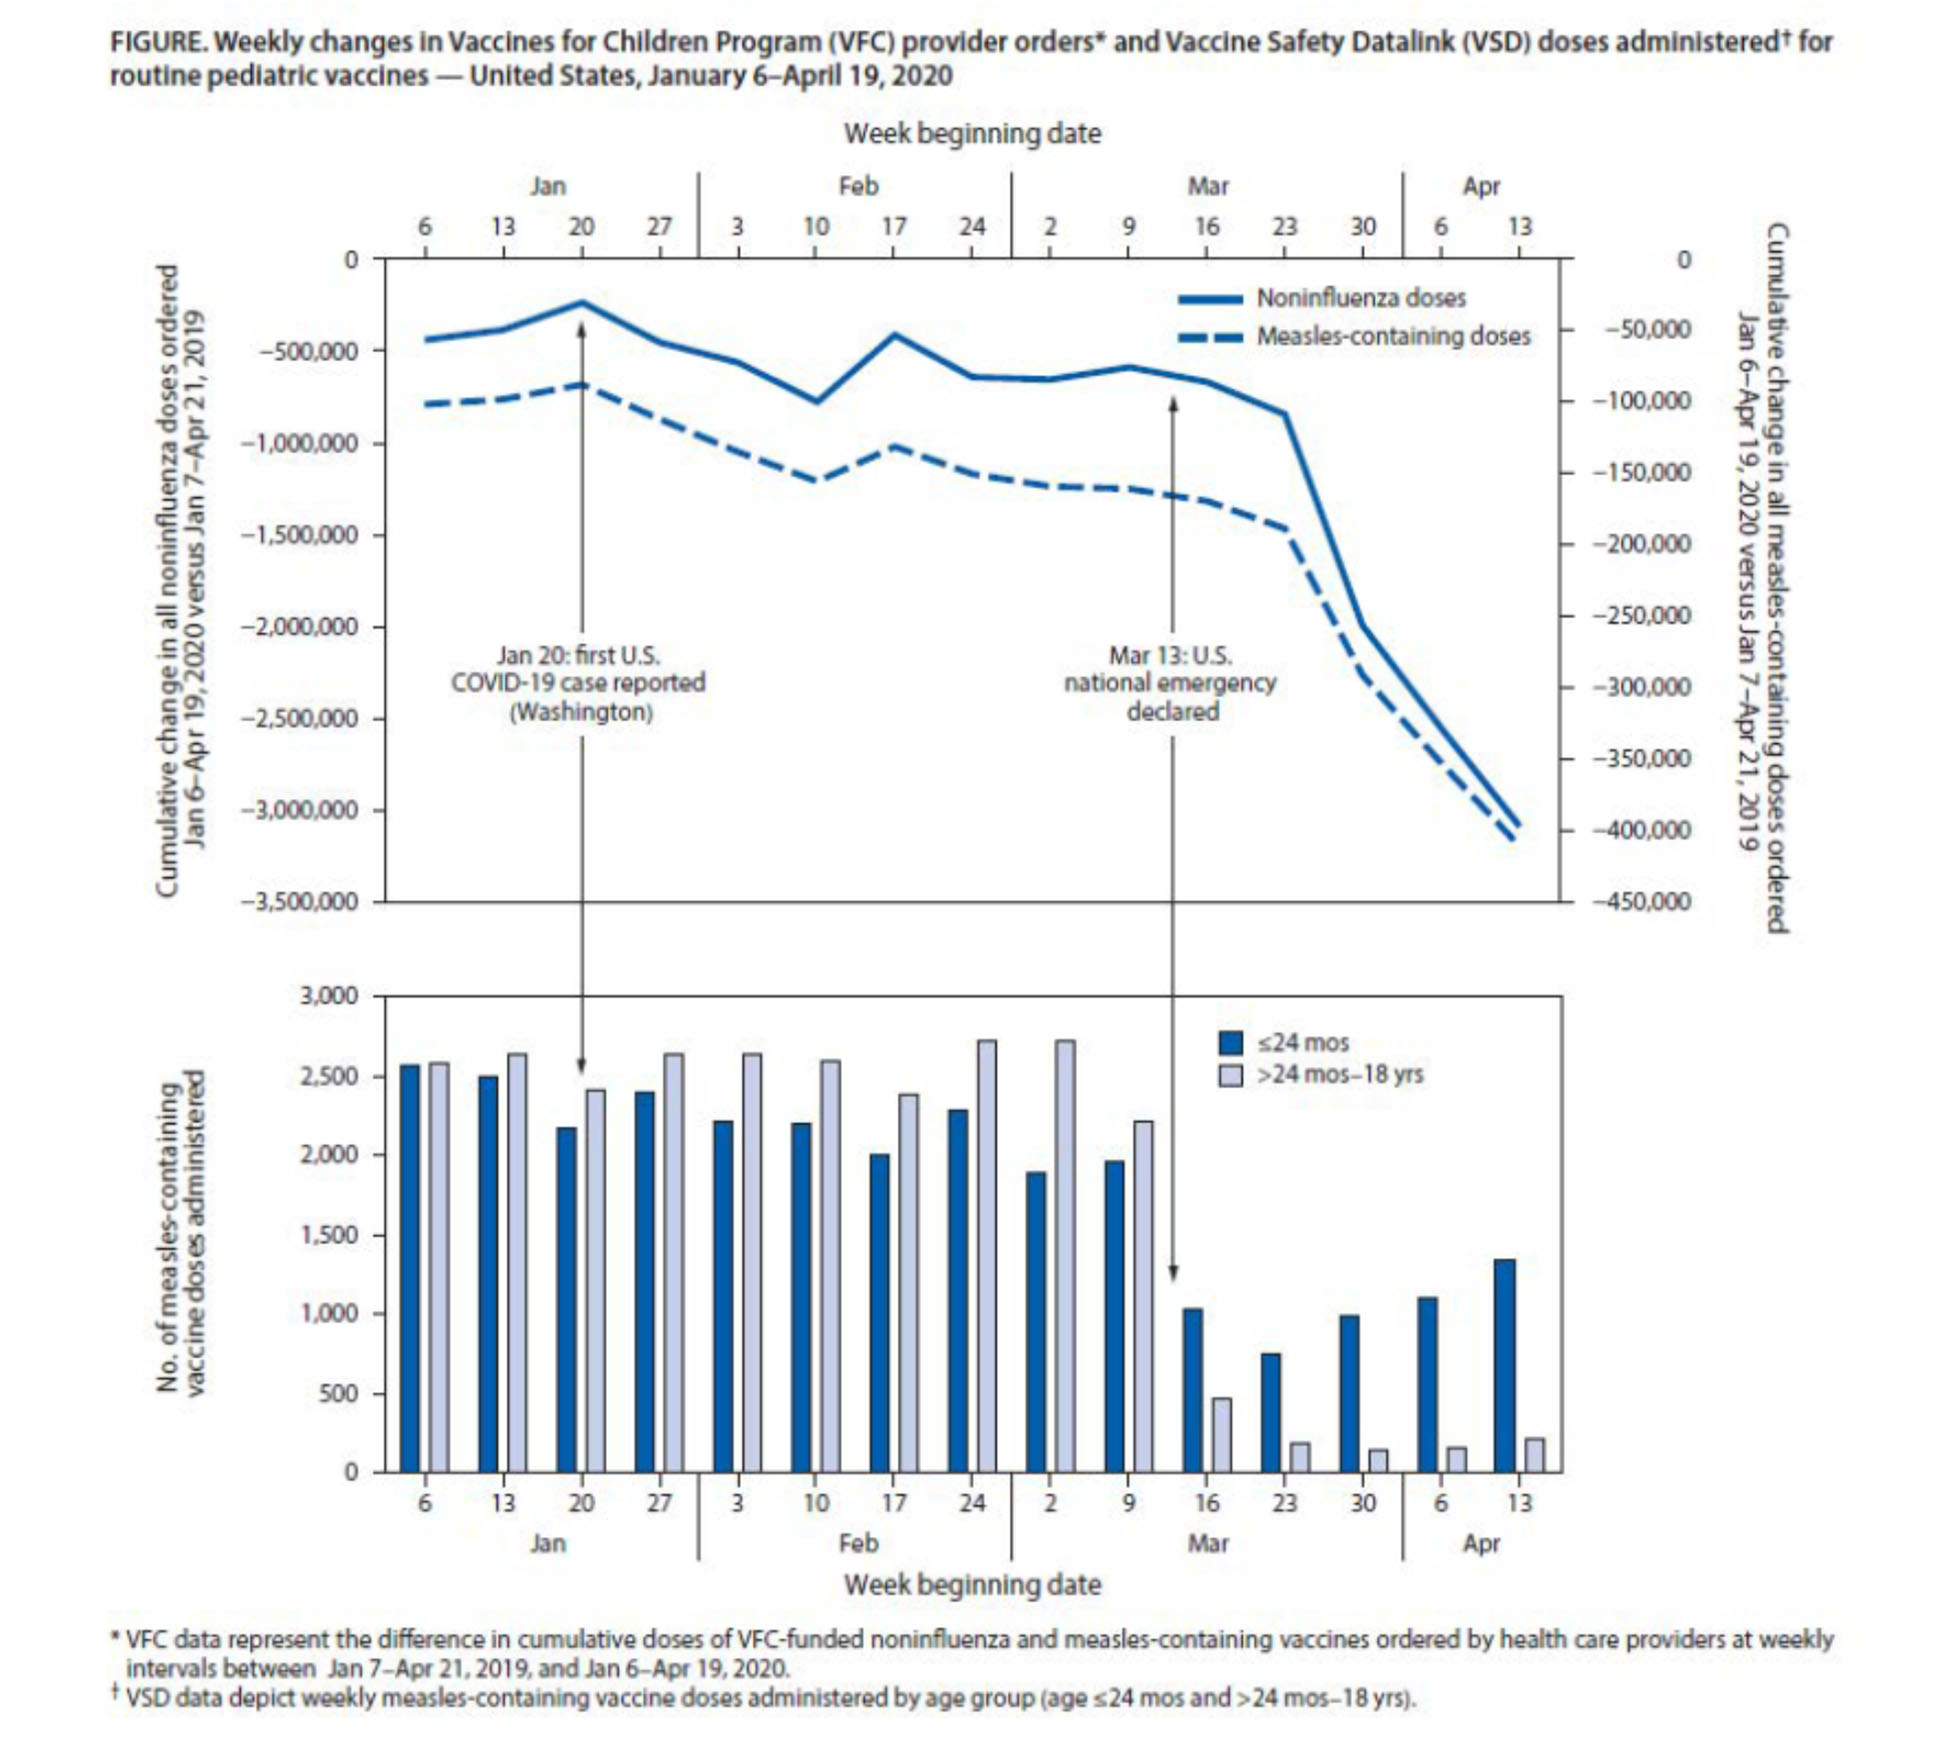
One very clear change that has received publicity is that public health officials are bemoaning the sharp decline in infant vaccinations as parents are not taking their infants into pediatric offices for their regular well‐baby checks. In the May 15 issue of the CDC Morbidity and Mortality Weekly Report (MMWR), a group of authors from the CDC and Kaiser Permanente reported a sharp decline in provider orders for vaccines as well as a decline in pediatric vaccine doses administered. [8] These declines began in early march, around the time infant deaths began declining.
This effect may not be confined to the U.S. The World Health Organization issued a press release on May 22 noting that, “Since March 2020, routine childhood immunization services have been disrupted on a global scale that may be unprecedented since the inception of expanded programs on immunization (EPI) in the 1970s.” [9] Are fewer children dying because their parents are skipping their routine childhood vaccines? If lives are being saved during the pandemic, this is a question that urgently needs answering.
* * *
Covid19 is unique among recent pandemics in that the mortality toll is measurable, real and convincing. It is also nearly certain to be transitory, but that won’t stop the propaganda juggernaut from rolling forward. However, as the saying goes, “the best laid plans of mice and men often go awry.” What no one would have predicted in advance of Covid19 is that the extreme lockdown response has produced a natural experiment that actually calls into question the very actions—widespread, mandated vaccines for all‐‐that the infectious disease and public health community have been pushing for years. We should mourn the deaths of the elderly Manhattan nursing home residents but also take heed of the hundreds of avoided infant deaths. Only with that kind of balance will we draw the proper lessons from the pandemic and the lockdowns that have followed in its wake.
References:
1. The Centers for Disease Control and Prevention. National Center for Health Statistics Mortality Surveillance System. [Online] [Cited: June 6, 2020.] https://gis.cdc.gov/grasp/fluview/mortality.html.
2. —. Provisional Death Counts for Coronavirus Disease (COVID‐19). [Online] [Cited: June 6, 2020.] https://www.cdc.gov/nchs/nvss/vsrr/COVID19/index.htm.
3. —. Provisional COVID‐19 Death Counts by Sex, Age, and Week. [Online] [Cited: June 6, 2020.] https://data.cdc.gov/NCHS/Provisional‐COVID‐19‐Death‐Counts‐by‐Sex‐Age‐and‐W/vsak‐wrfu.
4. —. Deaths involving coronavirus disease 2019 (COVID‐19) by race and Hispanic origin group and age, by state. [Online] [Cited: June 6, 2020.] https://data.cdc.gov/NCHS/Deaths‐involving‐coronavirus‐disease‐2019‐COVID‐19/ks3g‐spdg.
5. Social Security Administration. Actuarial Life Table. [Online] [Cited: June 7, 2020.]
https://www.ssa.gov/oact/STATS/table4c6.html.
6. The Centers for Disease Control and Prevention. Weekly counts of deaths by jurisdiction and age group. [Online] [Cited: June 7, 2020.] https://data.cdc.gov/NCHS/Weekly‐counts‐of‐deaths‐by‐jurisdiction‐and‐age‐gr/y5bj‐9g5w.
7. —. NCHS Data Brief, Number 355. [Online] January 2020. [Cited: May 16, 2020.]
https://www.cdc.gov/nchs/data/databriefs/db355_tables‐508.pdf#4.
8. Santoli, Jeanne M et al. Effects of the COVID‐19 Pandemic on Routine Pediatric Vaccine Ordering and Administration — United States, 2020. cdc.gov. [Online] May 15, 2020.
https://www.cdc.gov/mmwr/volumes/69/wr/mm6919e2.htm#F1_down.
9. World Health Organization. At least 80 million children under one at risk of diseases such as diphtheria, measles and polio as COVID‐19 disrupts routine vaccination efforts, warn Gavi, WHO and UNICEF. [Online] [Cited: May 23, 2020.] https://www.who.int/news‐room/detail/22‐05‐2020‐at‐least‐80‐million‐children‐under‐one‐at‐risk‐of‐diseases‐such‐as‐diphtheria‐measles‐and‐polio‐as‐covid‐19‐disrupts‐routine‐vaccination‐efforts‐warn‐gavi‐who‐and‐unicef.
Endnotes:
The Centers for Disease Control and Prevention note the following regarding underreporting in most recent weeks. To ensure that the signals we are reporting are not the result of these reporting lags, we have deliberately excluded the most recent four weeks of available data (the charts are week ending May 16, 2020, pulled June 6). Because CDC also re‐states historical data every time they refresh their datasets, we also refreshed all reported data for two prior years with every weekly dataset update.
Provisional counts are weighted to account for potential underreporting in the most recent weeks. However, data for the most recent week(s) are still likely to be incomplete. Only about 60% of deaths are reported within 10 days of the date of death, and there is considerable variation by jurisdiction and age. The completeness of provisional data varies by cause of death and by age group. However, the weights applied do not account for this variability. Therefore, the predicted numbers of deaths may be too low for some age groups and causes of death. For example, provisional data on deaths among younger age groups is typically less complete than among older age groups. Predicted counts may therefore be too low among the younger age groups. More detail about the methods, weighting, data, and limitations can be found in the Technical Notes.
Sign up for free news and updates from Children’s Health Defense. CHD focuses on legal strategies to defend the health of our children and obtain justice for those injured. We can't do it without your support.